Posts selected fromManagement Blog - Engineering Blog - Investing Blog and other blogs - Chart of Net Government Debt from 1980 to 2013 by Country
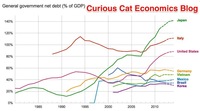 Bloomberg converted the data to look at debt load per person (looking at gross debt – estimated for 2014). Japan has ill-fortune to lead in this statistic with $99,725 in debt per person (242% of GDP), Ireland is in second with $60, 356 (121% of GDP). USA 3rd $58,604 (107%). Singapore 4th $56,980 (106%). Italy 6th $46,757 (133%). UK 9th $38,939 (95%). Greece 12th $38,444 (174%). Germany 14th $35,881 (78%). Malaysia 32nd $6,106 (57%). China 48th $1,489 (21%). India 53rd $946 (68%). Indonesia 54th $919 (27%). continue reading: Chart of Net Government Debt from 1980 to 2013 by Country - Helping Others
I have long used TrickleUp, Kiva and Global Giving to help (and they each do a good job of engaging donors (tugging on their heartstrings and making them happy to give).
I try to give back to the places I visit. So I integrate this into my digital nomad life. As with many digital nomads I have an affinity for entrepreneurs and my charity often focuses on helping them (Global Giving does other things too – such as providing clean water, electricity, education and training…). continue reading: Helping Others - Wealthiest 1% Continue Dramatic Gains Compared to Everyone Else
The least trust-fund-baby favoring country cultures are Scandinavian countries. The USA has been moving to an increasingly trust-fund-baby favoring focus over the last few decades with the expected increase in kids incomes being more related to their parents income than any other factor. In the USA now nearly 50% of someone’s income can be “explained” by their parents income. continue reading: Wealthiest 1% Continue Dramatic Gains Compared to Everyone Else - USA Health Care Spending 2013: $2.9 trillion $9,255 per person and 17.4% of GDP
The slow down in how badly the health care system has performed in the USA has resulted in the share of GDP taken by the health care system finally stabilizing. Health care spending has remained near 17.4% since 2009. While hardly great news, this is much better news than we have had in the last 30 years from the USA health care system. The percentage of GDP taken by the USA health care system is double what other rich countries spend with no better health results. continue reading: USA Health Care Spending 2013: $2.9 trillion $9,255 per person and 17.4% of GDP - The Fed Should Raise the Fed Funds Rate (Sep 2015)
The issue I see is that a .25% Fed Funds rate is adding gasoline to the economy via low interest rates. Many people are saying an increase is like taking away the gasoline and taking out a fire extinguisher. But it really isn’t. Raising the rate to .25% is slightly decrease the amount of gas you are adding to the fire. continue reading: The Fed Should Raise the Fed Funds Rate (Sep 2015) - Decades Later The USA Health Care System is Still a Deadly Disease for Our Economy
Health care is extremely expensive everywhere. But in the USA the health care system is twice as costly as other rich countries. This is an enormous burden on the USA economy. Nothing else comes close to being as costly in terms of direct spending. And there a a great deal of other damage done that can’t be seen in just the 100% more the USA spends on health care than other rich countries spend. And the health outcomes are no better for the extra hundres of billions of dollars spent every year for health care in the USA.
The costs of decades of failure are extrodinary. continue reading: Decades Later The USA Health Care System is Still a Deadly Disease for Our Economy - Economics: Digital Nomads, Visas, Foreign Currency
 The prohibition against work on tourist visas makes sense when work is defined as it was historically (being hired by a company in the country that otherwise would have hired a citizen)...
Few laws say what is legal they normally say what is not. I would imagine few countries specifically say it is legal to do work from another country (as a digital nomad, as a employee answering an email on your vacation, as a private investor reading the news and using the internet to buy or sell a stock using your broker at home, as a writer writing your book that will be published back home or whatever). It seems pretty obvious you are not blocked from answering a work email while on vacation but exactly at what point a country wants to draw a line on acceptable work on a tourist visa and unacceptable work is not easy. continue reading: Economics: Digital Nomads, Visas, Foreign Currency - USA Health-Care System Ranks 50th out of 55 Countries
None of these rankings are perfect and neither is this one. But it is clear beyond any doubt that the USA healthcare system is extremely costly for no better health results than other rich countries (and even more expensive with again no better results than most poor countries). It is a huge drain on the economy that we continue to allow lobbyists and special interests to take advantage of the rest of us... continue reading: USA Health-Care System Ranks 50th out of 55 Countries - Solar Energy Capacity Continues to Grow Rapidly (Chart of Data by Country)
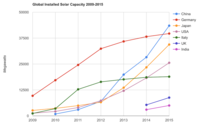 The International Energy Agency (IEA) estimates Italy has the largest percentage of electricity needs capable of being produced by installed PV systems at 8%, with Greece at 7.4% and Germany at 7.1%. Japan is ranked 5th at just under 4%, UK is 12th at 2.5%, China is 22nd at 1%, India 24th and the USA 25th at close to .9%. They estimate the total global percentage at 1.3%.
The global percentage is rapidly increasing each year as solar costs have shrunk and the benefits of reducing climate change causing pollution are known to be extremely important for the future of the planet. continue reading: Solar Energy Capacity Continues to Grow Rapidly (Chart of Data by Country) - Science and Engineering Macroeconomic Investment
 The United States has benefited tremendously from the decisions to fund the National Science Foundation (as well as other investments in science) for decades. Other countries have seen the wisdom in those investments and seem to be committing much more to those investments than the US lately. I think it is very wise of them and will serve the world well. But I fear the United States has already allowed itself to lose a great deal of the competitive advantage it built up in the middle of the last century.
In the last couple decades we have been able to coast on the lead we had. We could have many of the best minds come to our colleges and then keep them here once they graduated with advanced degrees. However, the lead we had is rapidly being eliminated. This does not mean the US will immediately be uncompetitive. But it will mean one of the great advantages we had will be greatly reduced.
The United States still has competitive advantages that will continue to serve us well in harnessing advanced technology for economic gain. But others have been making strategic decisions to gain some of those advantages for themselves. And the United States will almost certainly continue to see its scientific and engineering leadership in the world erode. And the economic consequences will be dramatic. continue reading: Science and Engineering Macroeconomic Investment - Manufacturing and the Economy (2005)
The conventional wisdom was that the rest of the world would not be able to compete with the United States for high wage, high value jobs. It turns out the rest of the world is much more able to compete for that work than was expected.
...
I think we often talk as though manufacturing in the United States is not feasible. Yes, things are changing, and have been for several decades. But the United States is still the largest manufacturer in the world.
It is true (in my belief – and based on the statistics above and in the graphs) that the United States has been decreasing manufacturing employment. And it is also true other countries – notably: China, Korea and Mexico are increasing manufacturing output. However, I believe the there has been no increase (in fact I believe their has been a decrease) in manufacturing jobs worldwide.
[in future posts I was able to find data that showed in fact China, while manufacturing output was booming, actually lost more manufacturing jobs than the USA did: Manufacturing Employment Data: USA, Japan, Germany, UK… 1990-2009, Manufacturing Job Losses: USA 2 million, China 15 million from 1995-2002, Global Manufacturing Employment Data – 1979 to 2007, Manufacturing Jobs Data: USA and China, ] continue reading: Manufacturing and the Economy (2005) - Manufacturing Jobs Data: USA and China
10-20% of manufacturing jobs disappeared worldwide from 1995 to 2002. China lost between 17% and 34% of theirmanufacturing jobs and the USA lost 11.4% of theirs. continue reading: Manufacturing Jobs Data: USA and China - China’s Manufacturing Economy
The constant mention of the eroding manufacturing sector on the USA I believe leads many to think it is shrinking and small. Yet output continues to increase and the share of worldwide manufacturing output is holding steady. China is gaining substantial ground but the Chinese increase has largely come from Japan and Europe. To me this understanding is important because of my felling about the misperceptions of many. continue reading: China’s Manufacturing Economy - Toyota in the US Economy
 From Toyota’s web site: Toyota Manufacturing in the USA: by 2008, Toyota will have the annual capacity to build 1.81 million cars and trucks, 1.44 million engines, and 600,000 automatic transmissions in North America.
The company’s direct employment in North America is more than 38,000 and direct investment is nearly $16.8 billion with annual purchasing of parts, materials, goods and services from North American suppliers totaling an additional $26 billion.
[In 2016 Toyota manufactured 2,450,000 vehicles in the USA, Toyota promotes a fake number for employees counting many non-employees, employees of suppliers etc., so you can't view the accurate data on their site in 2017 - in 2006 they did post an honest number]. continue reading: Toyota in the US Economy - Our Energy Future (2006)
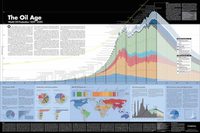 Huge price increases will provide incentives to those in the market to innovate to find alternative ways to make money by providing usable energy sources. If the market, overall, chooses to look forward over a long period of time, then investment in alternatives will begin in earnest early and prices of oil will slowly rise. And as prices rise slowly new alternatives (including ways of reducing consumption) will slowly come into the market. Those alternatives will slowly substitute for oil as a smooth transition is made.
If markets actual were efficient and driven by looking far into the future and discounting cash flows to the present this slow and steady model is what would happen. The market can only be efficient if good long term predictions can be reflected in the market. continue reading: Our Energy Future (2006)
|